Service

Presentations

1 day — clean, on-brand slides
7 days — structured deck with visuals + story
1 month — 3 powerful, editable presentations

What could we achieve in

1-day design sprint

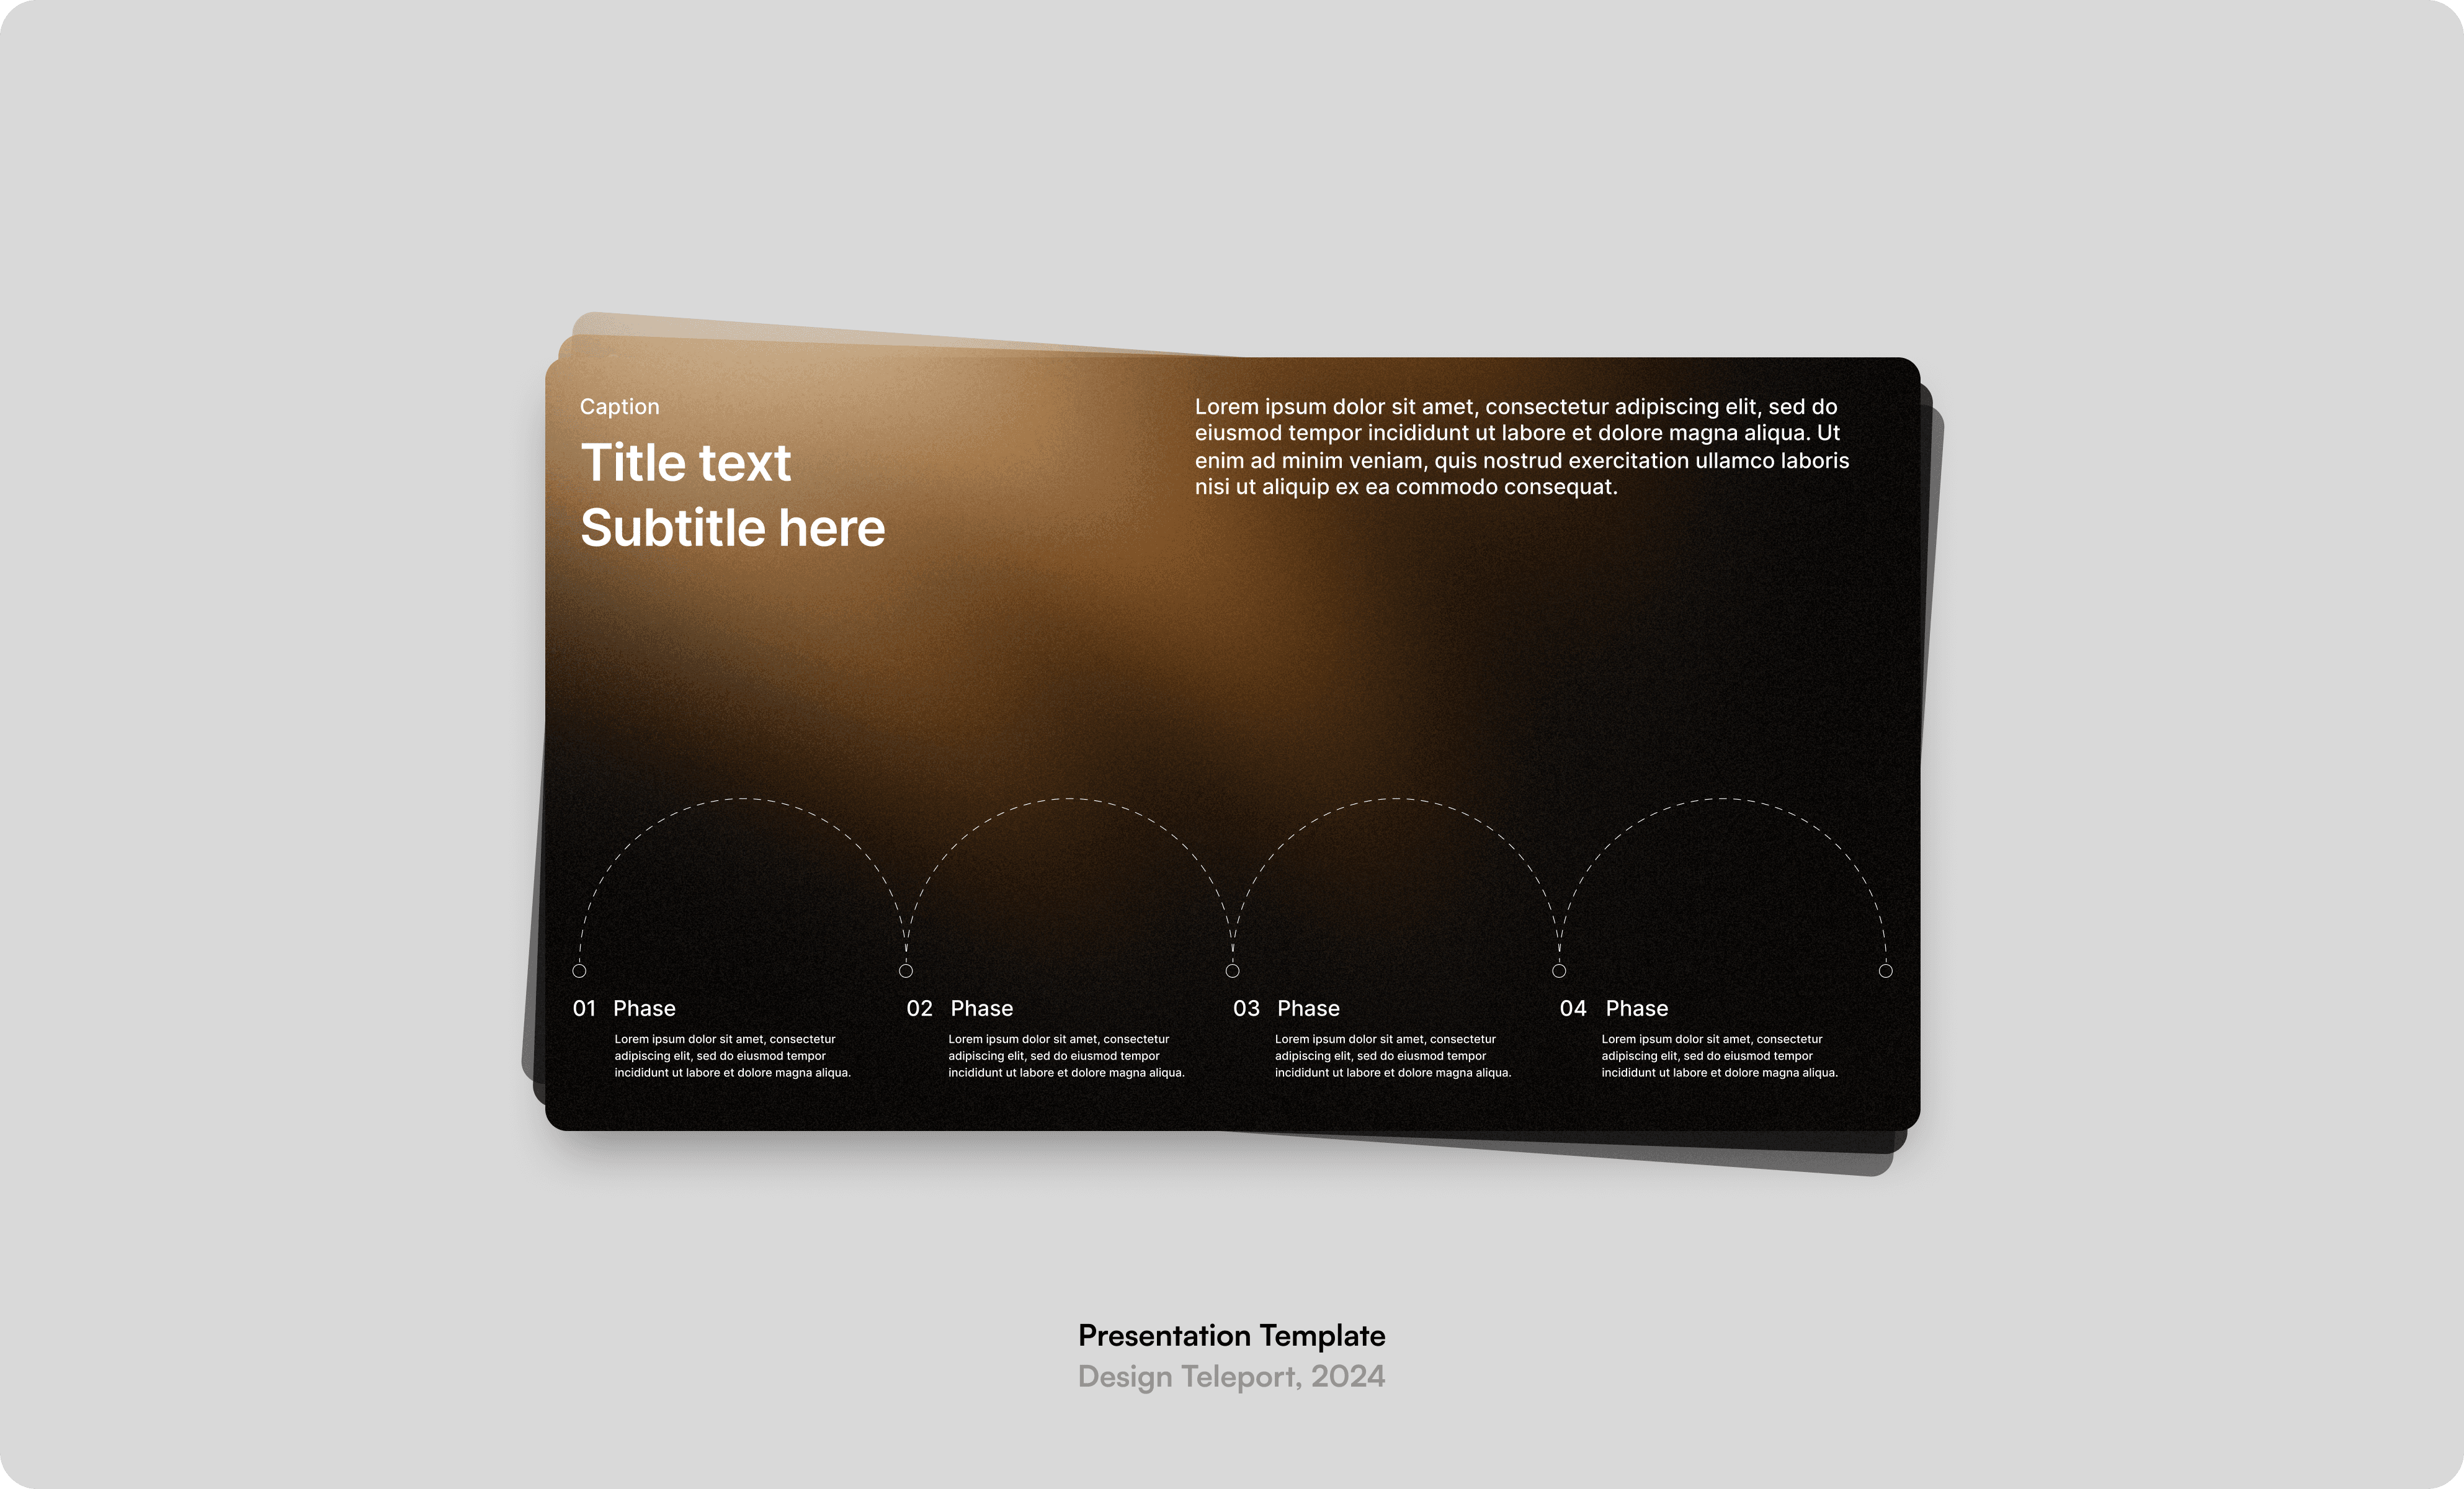
/ 8+ Polished Slides

/ Clear Structure

/ Сorporate Style

Laizy Guide, Presentation title
Presentation slide showing market growth and user opportunity curve for a travel tech startup.
Analytics slide showing campaign performance in Munich with high CTR and engagement.
Cost breakdown slide showing \$0.12 per tour and \$7.20 annual cost per user.
Dark-themed cybersecurity slide featuring the logo “Threat\_Breaker” with the tagline “Breaking threats before they break you.”
Cybersecurity market slide showing 25% YoY growth and \$5.5B in SMB cybercrime losses.
Cybersecurity metrics slide comparing cost, efficiency, and deployment speed—highlighting major improvements with Threat\_Breaker.
Market size slide with TAM at \$30B, SAM at \$8B, and SOM at \$90M.

What could we achieve in

1-week design sprint

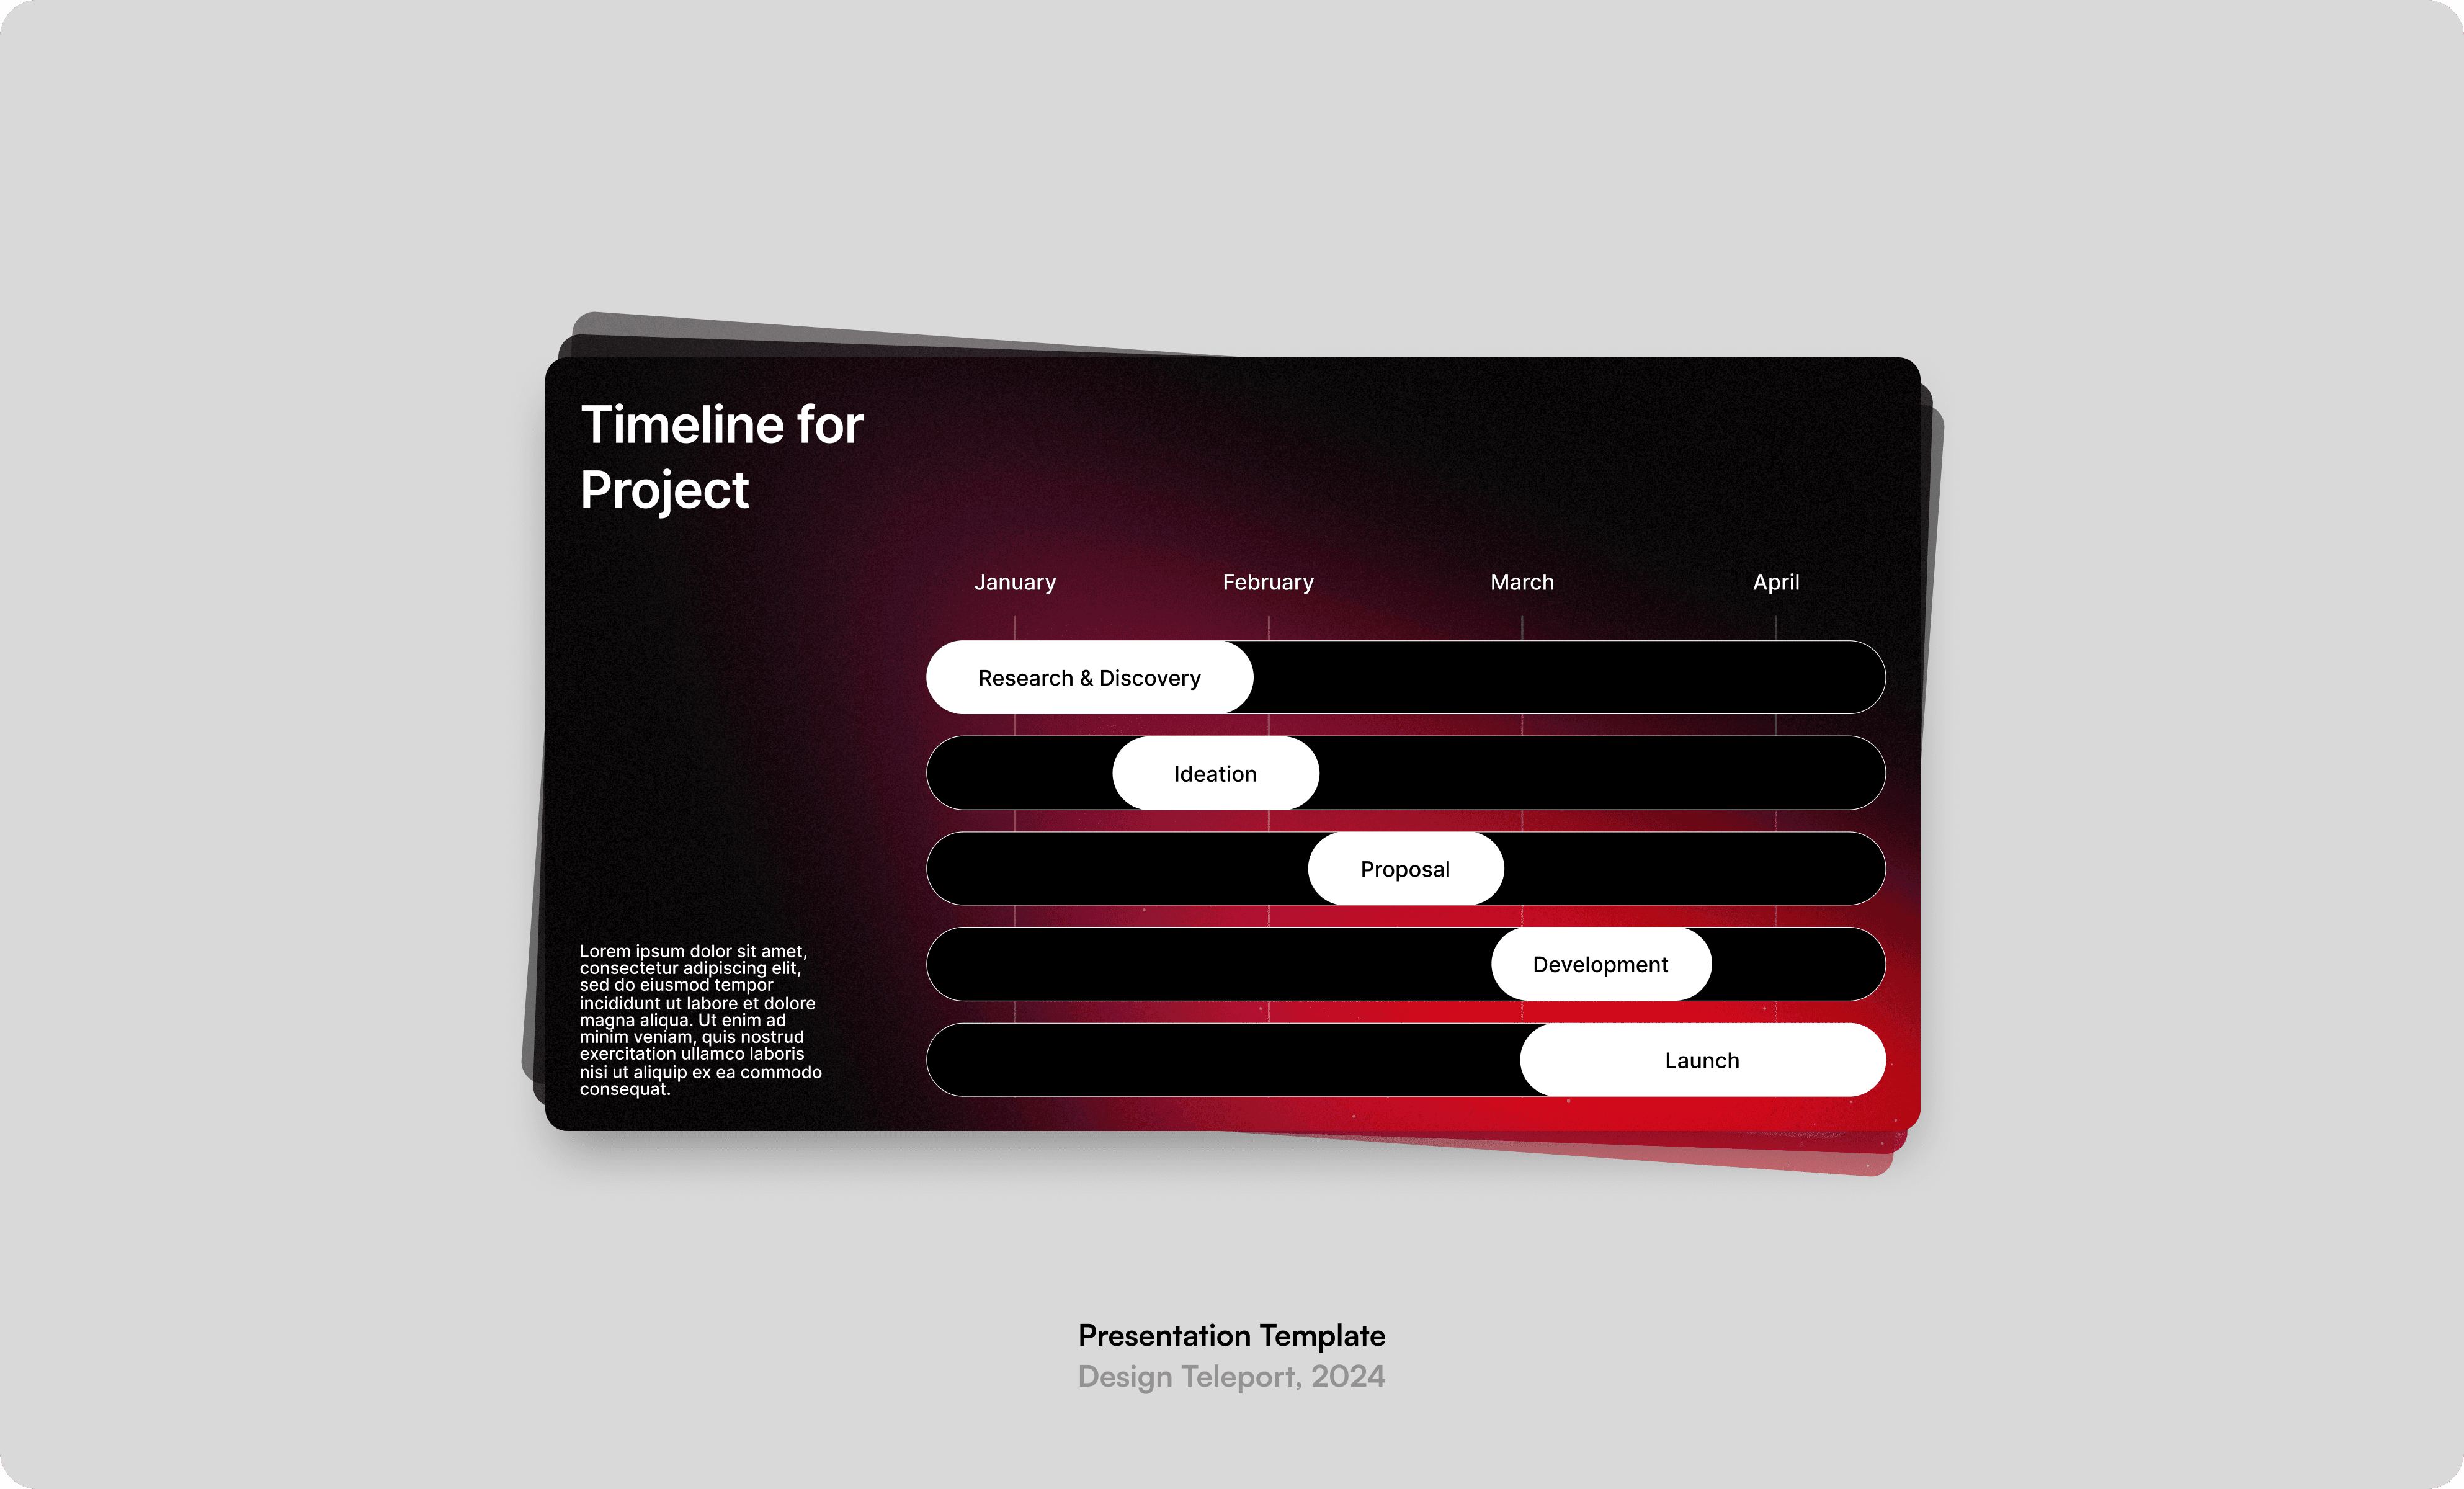
/ A Full Presentation

/ 40+ Slides

/ Conversion to PowerPoint

Presentation cover slide with abstract background and title: “Designing the Experience of All the Things Everywhere.”
Content slide with black layout, text block on the left, and abstract iridescent 3D shapes on the right.
Three-column layout slide showing section titles with abstract 3D visuals: geometric shapes, glowing prism, and a glassy ring.
Black timeline slide showing project phases from Market Research to Sales Scaling, with labeled time bars across columns.
Minimal black slide showing "\$500B" with a rising line graph and gradient area chart on the right.

What could we achieve in

1-month design sprint

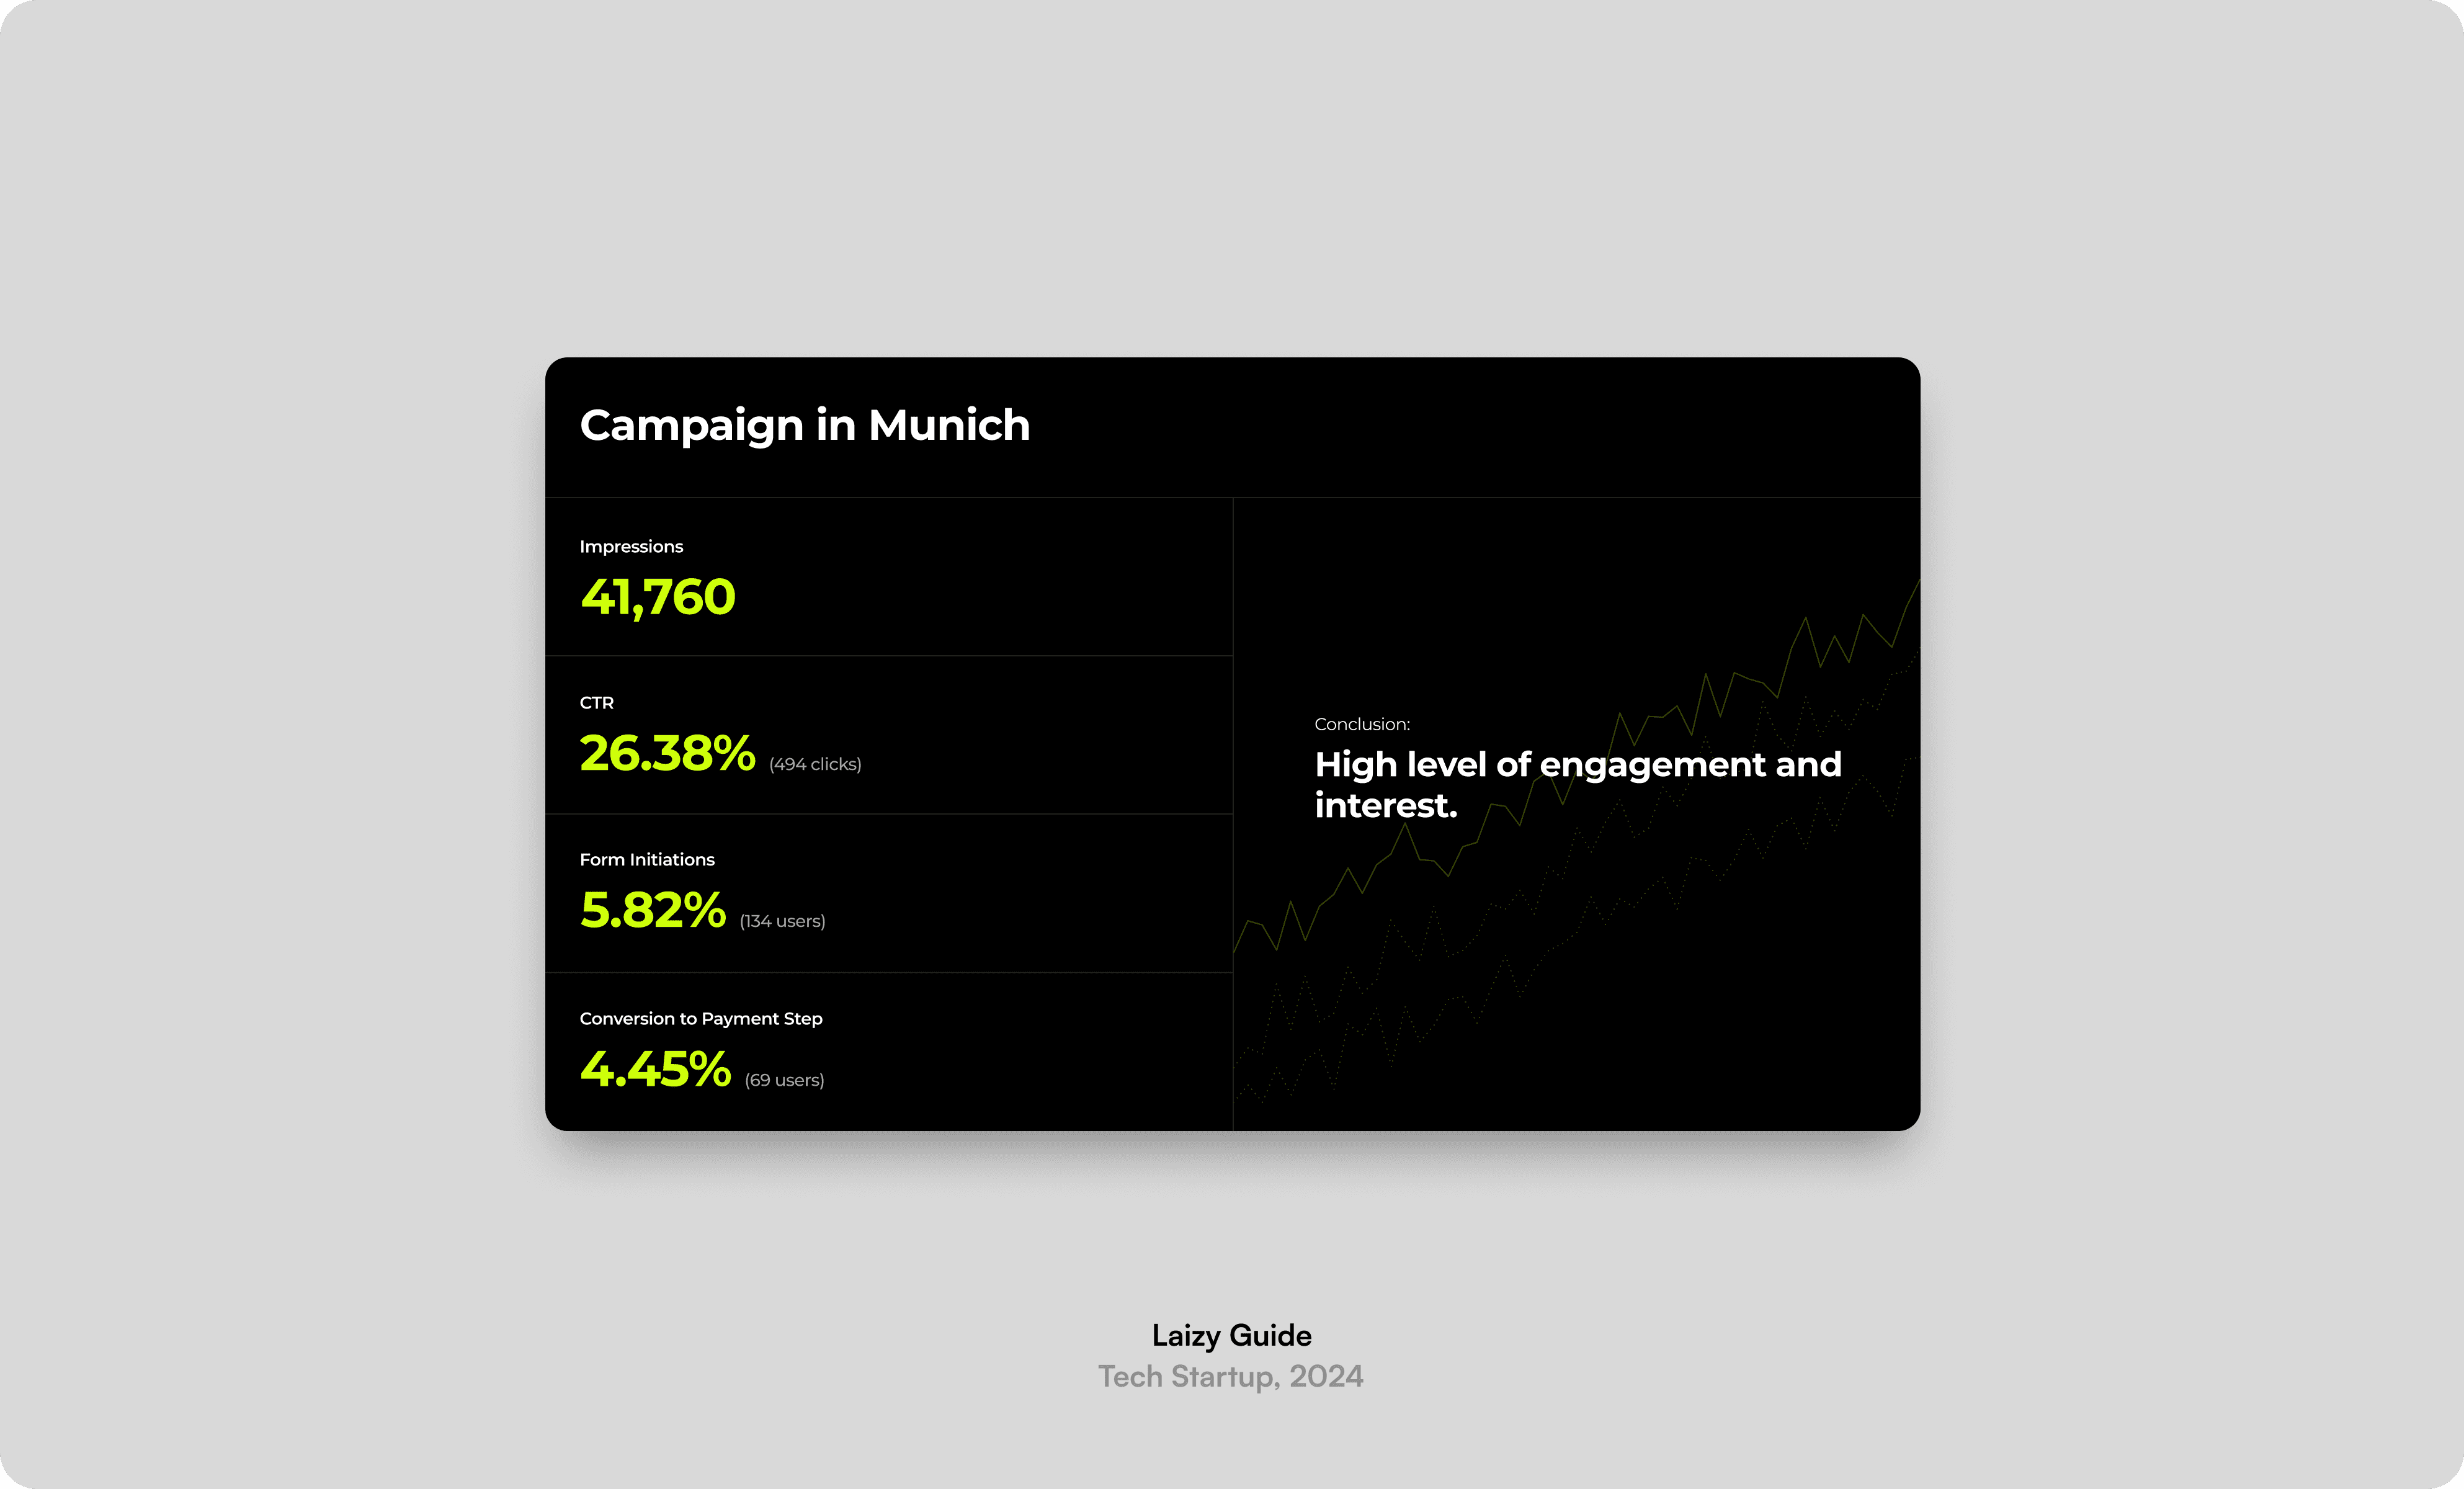
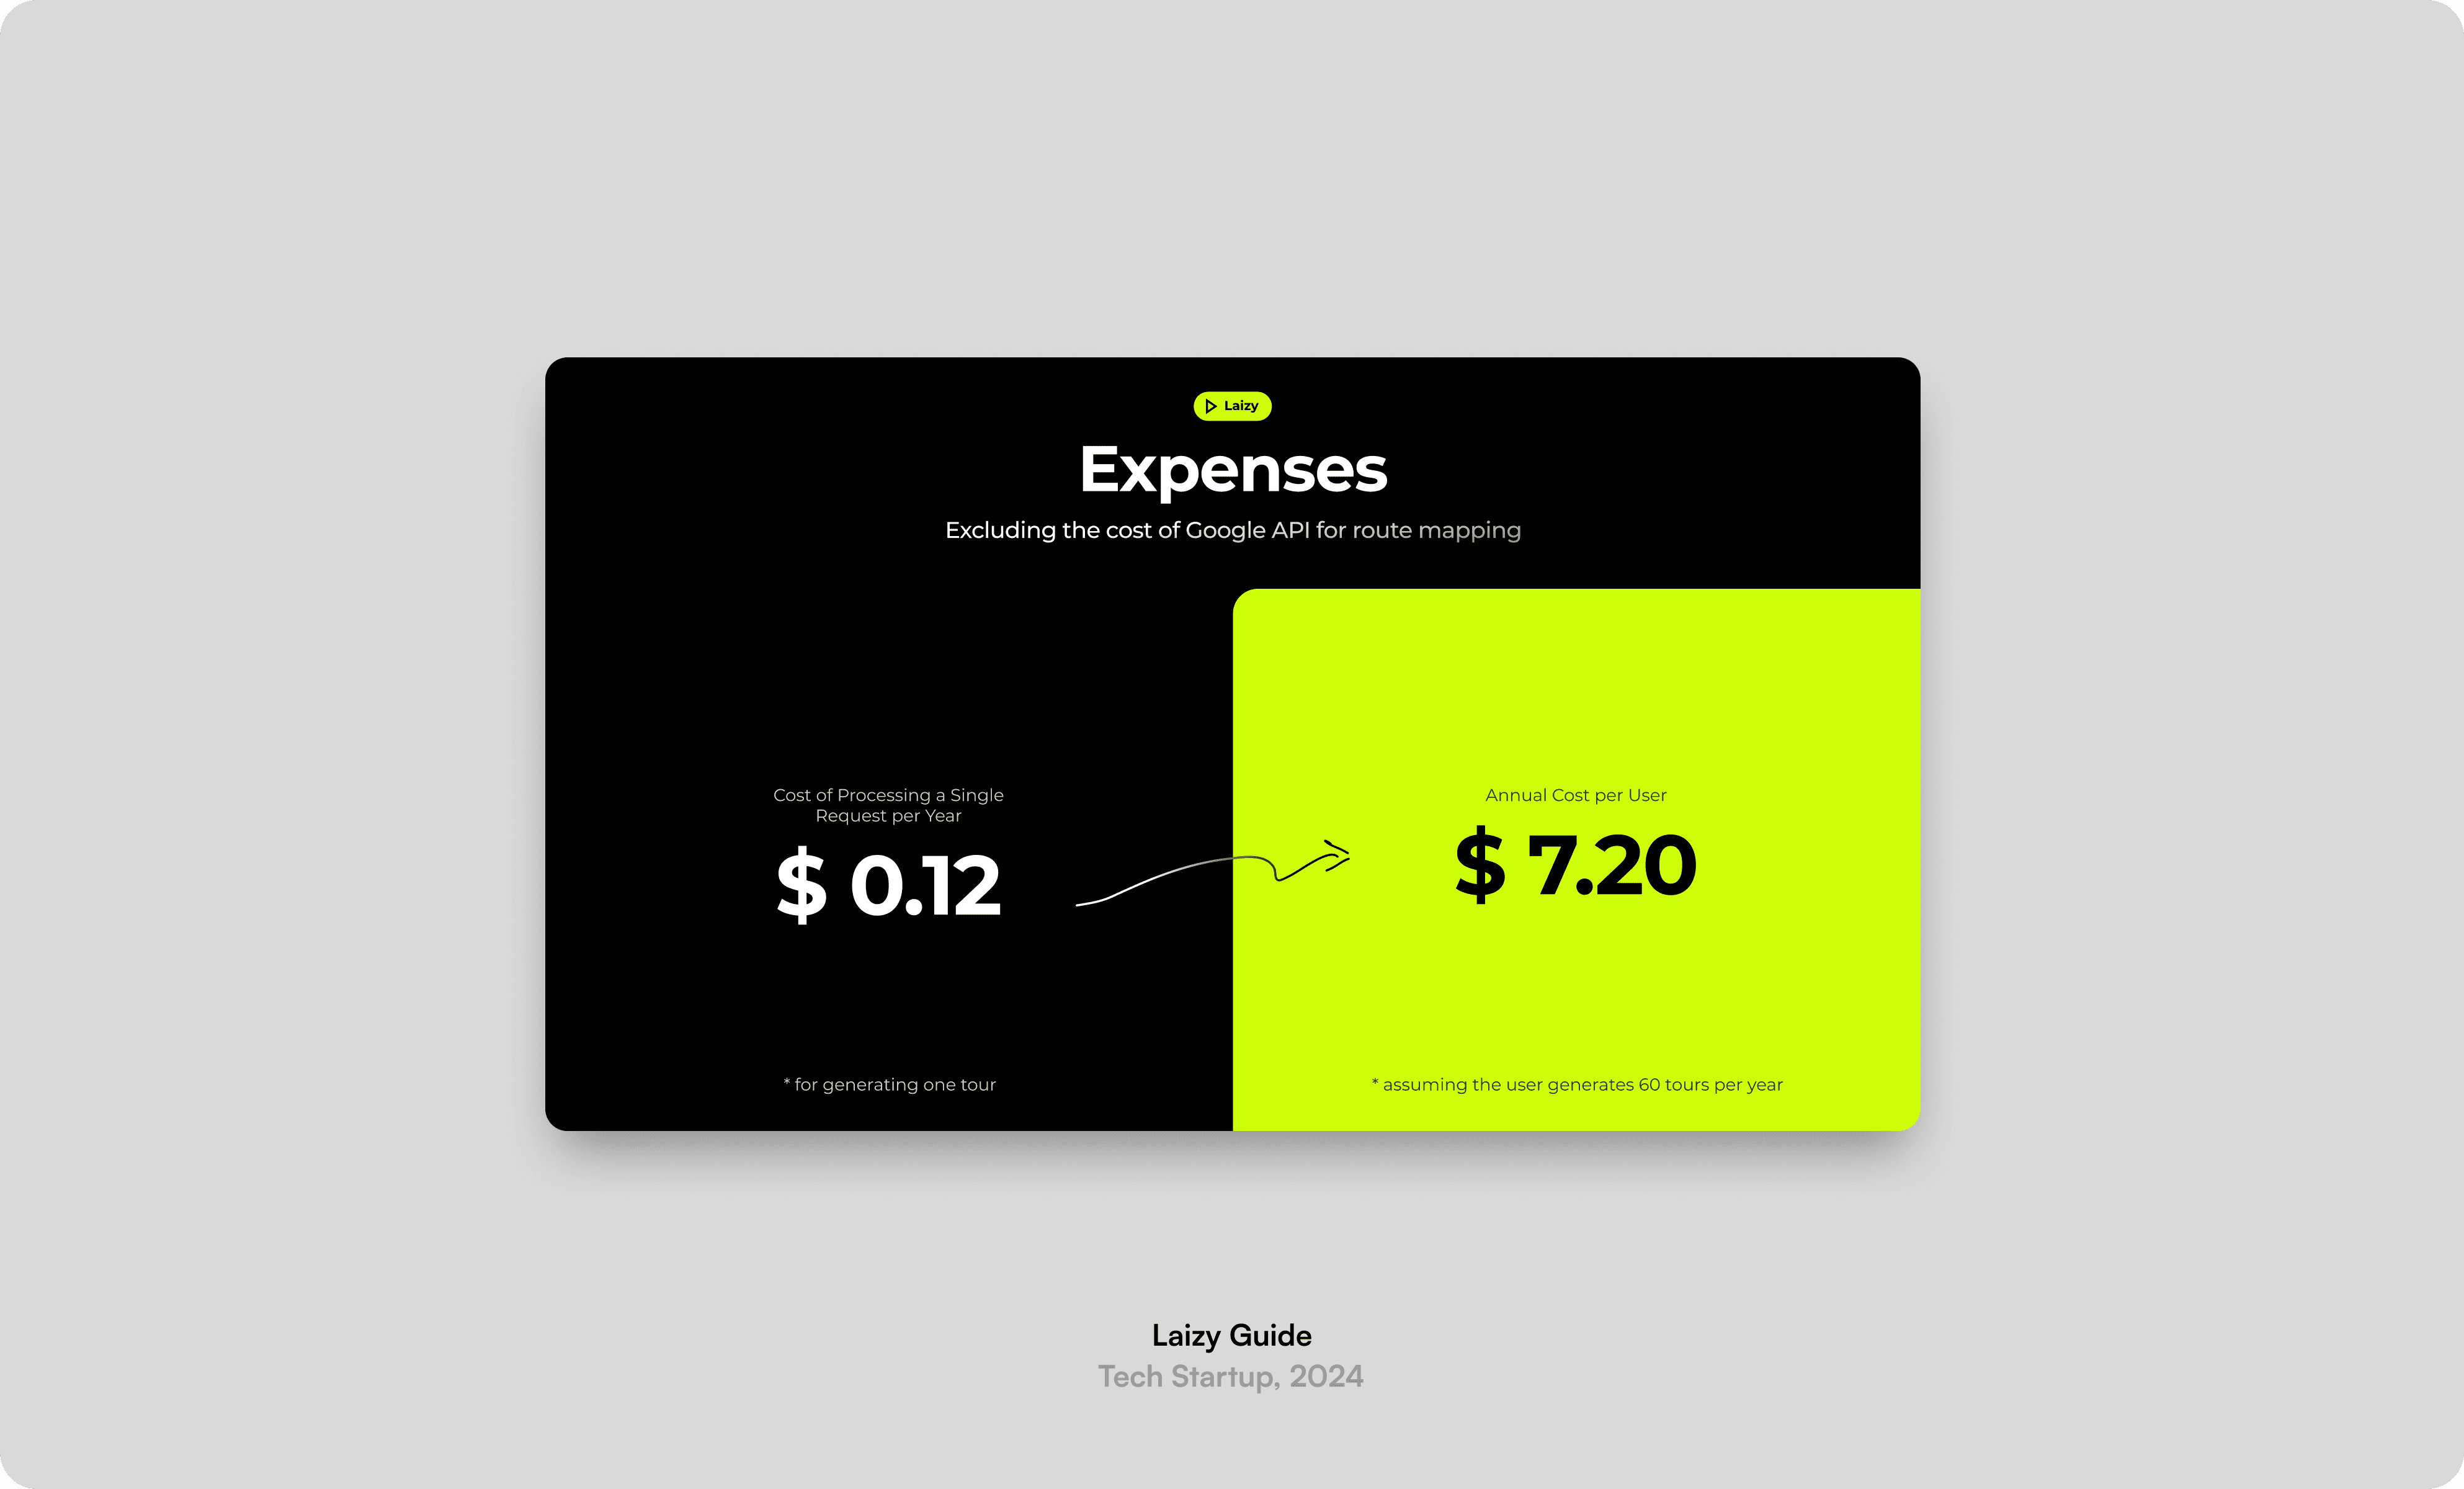
/ 3 High-quality Presentations

/ Cohesive Design System

/ Ready to Edit

Dark slide with four labeled phases in a horizontal timeline connected by dotted arcs, featuring a glowing orange gradient background and placeholder text.
Dark-themed bar chart slide with five vertical white bars labeled with values (150–200), minimal axis labels, and "Chart for Project" title in the top left corner.
Dark-themed presentation slide with a spider chart on the right showing data across the days of the week, using overlapping colored polygons. Left side includes a "\$925M" figure, caption, and placeholder text.
Dark gradient slide with horizontal project timeline showing tasks from January to April: Research & Discovery, Ideation, Proposal, Development, and Launch.